Think your city has the worst drivers? These cities really do. According to the Allstate America’s Best Drivers Report, the cities on this list are ranked among the bottom 20 cities for safe driving in America. They have the shortest time between accidents and the highest likelihood of experiencing collisions — all of them far higher than the national average.
Just how bad is it? In Boston, the absolute last city for safe driving on Allstate’s list, drivers go just 3.7 years in between accidents, and they’re 167 percent more likely to experience accidents than the national average. It gets better, but not by much. In Portland, the best of the worst, drivers are still experiencing accidents every 7.2 years on average, and they’re 39 percent more likely to get into a collision than the average American.
Want to stay safe on the road? Steer clear of these dangerous driving cities and their metro areas. Traffic conditions, driving habits, weather, and other factors are clearly playing their part in making driving difficult and often unsafe. And if you happen to live in one of these poor driving cities, drive vigilantly and consider enrolling in a defensive driving course to improve your skills and become a much safer driver than before.
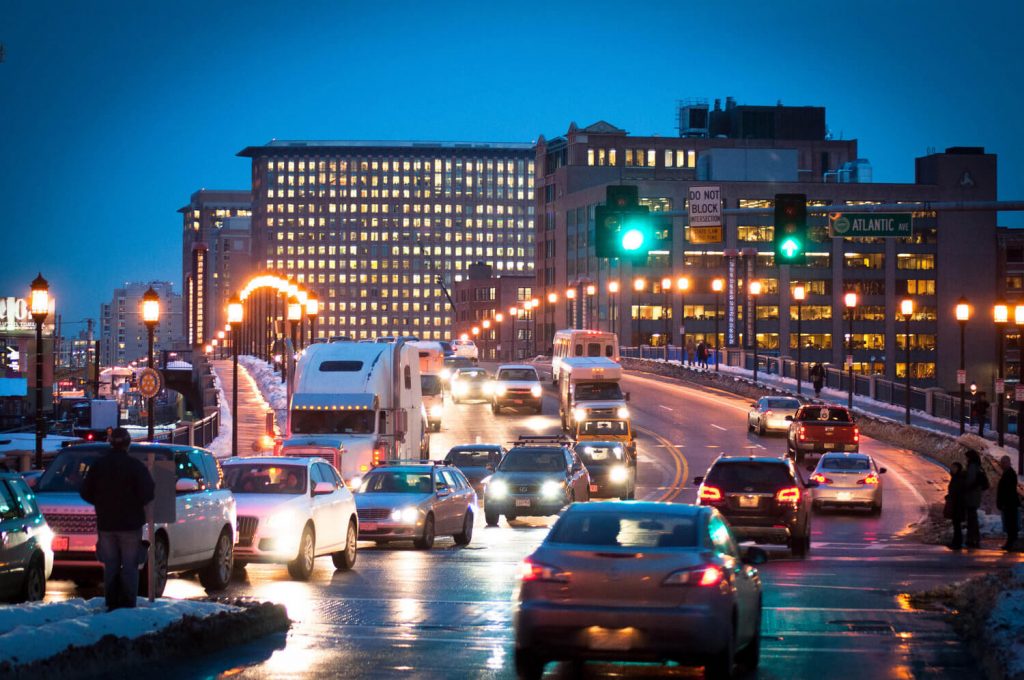
Photo by https://www.flickr.com/photos/pocheco/
1. BOSTON, MA
Population Density: 200
Rain and Snow: 200
Hard Braking Events per 1,000 miles: 17.8
Boston gets a bad rap for driving skills, and it’s not undeserved. Boston is ranked dead last for safe driving cities in America (they were also 200th in 2015). So unless you live in Boston, sorry (or not sorry), your city does not, in fact, have the worst drivers — they do. Boston Drivers are 167.7 percent more likely to have an accident than the average driver in America. Typically, Boston drivers have an accident every 3.7 years, the worst in the country. Boston drivers often slam on their brakes — and on top of bad drivers, Bostonians have to deal with rain and snow, too.
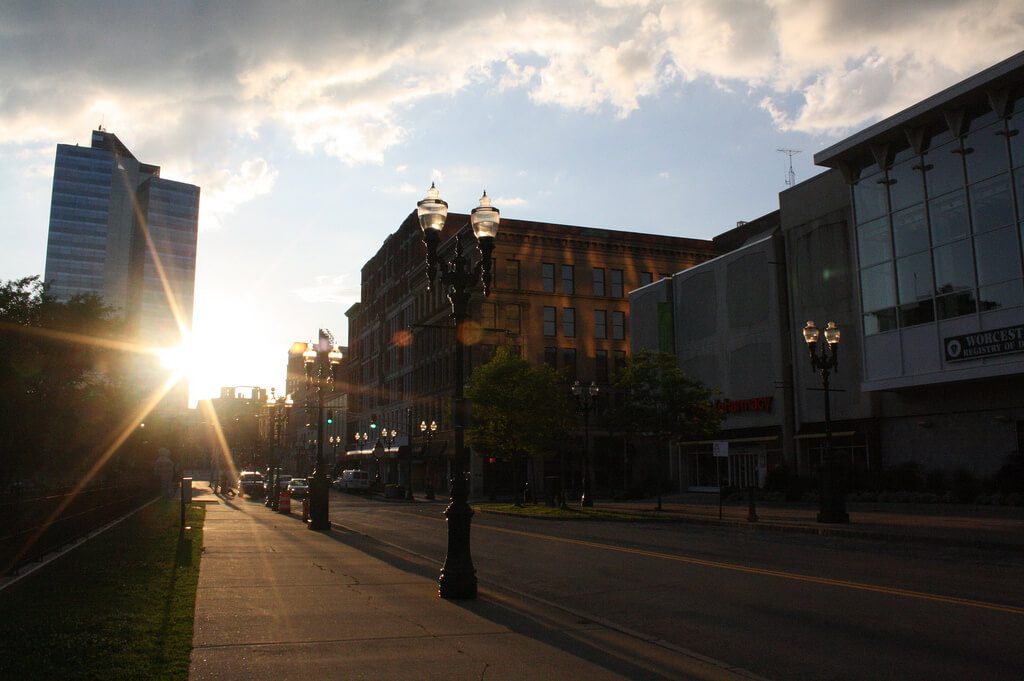
Photo by https://www.flickr.com/photos/leonardodasilva/
2. WORCESTER, MA
Population Density: 199
Rain and Snow: 199
Hard Braking Events per 1,000 miles: 18.9
Boston certainly isn’t alone in bad driving. Nearby Worcester is almost as bad — and in fact, Worcester has more hard braking events per mile than Boston does. Worcester was also ranked 200, only beat out by Boston in the past two years. What’s wrong with Worcester drivers? Like Boston, they have a high population density paired with rain and snow challenges. But drivers in Worcester also tend to be rude and lack common courtesy. Road rage is a problem, and drivers are more likely to get into an accident in Worcester than in many other places in the United States.
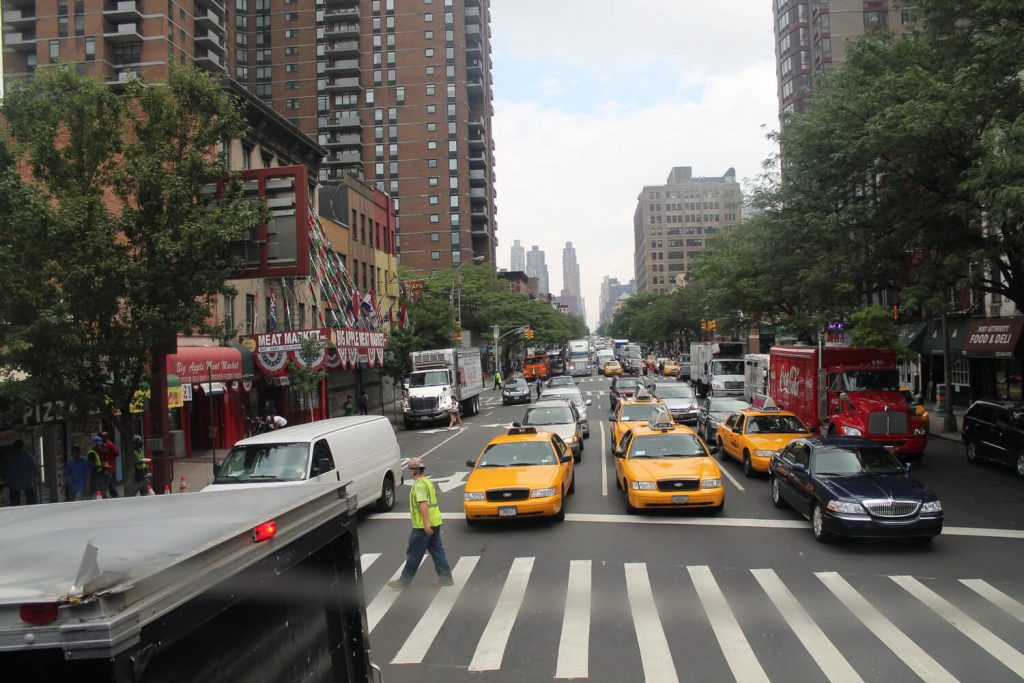
Photo by https://www.flickr.com/photos/perspective/
3. BALTIMORE, MD
Population Density: 198
Rain and Snow: 198
Hard Braking Events per 1,000 miles: 21.6
Baltimore doesn’t fare much better, ranked at 198 for both population density and rain and snow. And the city has even more hard braking events per mile than both Boston and Worcester. Although fatalities, DWI deaths, and pedestrian strikes are less than some of the worst cities, Baltimore still has a high collision rate. Most drivers in Baltimore make it just five years in between accidents. There’s no question why: red-light runners, poor turn signaling, and texting while driving are serious problems in Baltimore. Drivers say taxis cause traffic issues as well.
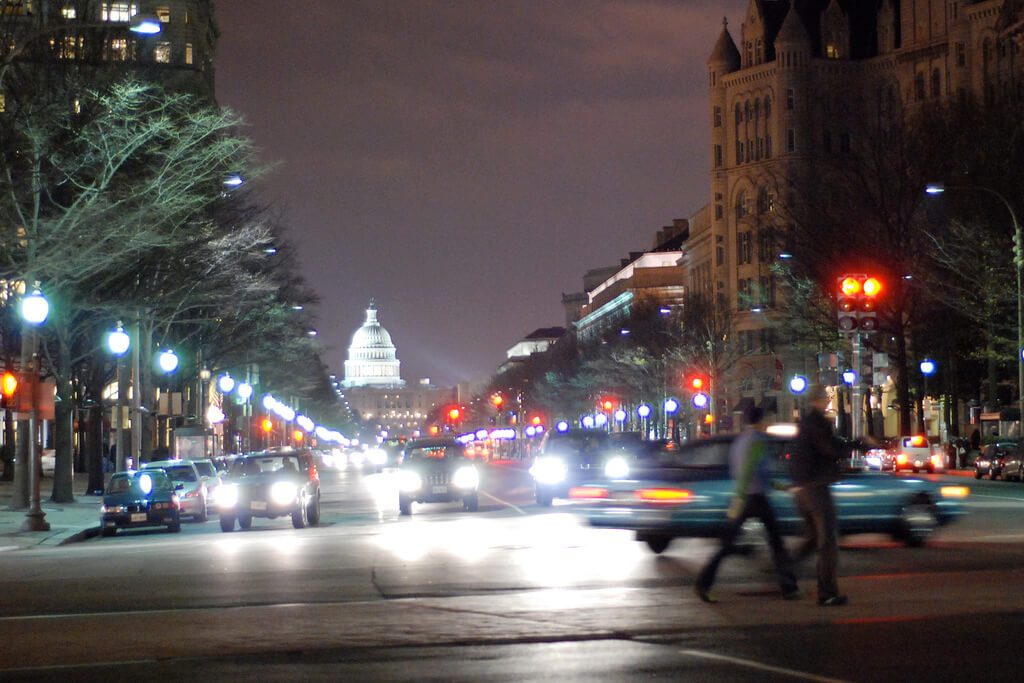
Photo by https://www.flickr.com/photos/hyku/
4. WASHINGTON, DC
Population Density: 197
Rain and Snow: 197
Hard Braking Events per 1,000 miles: 17
As the nation’s capital, Washington D.C. should be setting a great example for driver safety. Unfortunately, that’s not the case as the district remains at 197th place for safe driving. Drivers in D.C. simply have collisions more frequently, as expected in a busy city where many residents have cars. They go just 4.8 years between accidents on average.
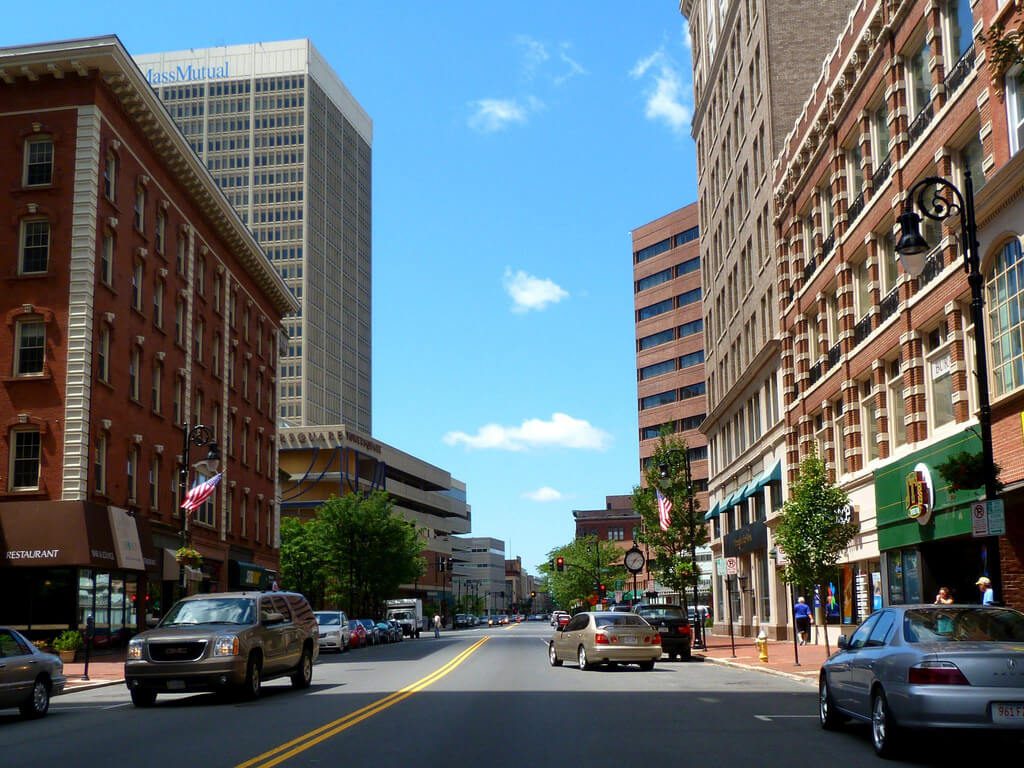
Photo by https://www.flickr.com/photos/rusty_clark/
5. SPRINGFIELD, MA
Population Density: 196
Rain and Snow: 196
Hard Braking Events per 1,000 miles: 16.2
Once again, Massachusetts struggles with driver safety. Drivers in Springfield suffer from the same troubles that plague Boston and Worcester: population density, rain, snow, and often, rude drivers. In Springfield, drivers are 93.1 percent more likely to get into a traffic accident than the national average, and they go an average of 5.2 years between accidents. Springfield has the fifth-highest relative accident likelihood when compared to the national average. Drivers also report that texting and driving is a serious problem in Springfield.
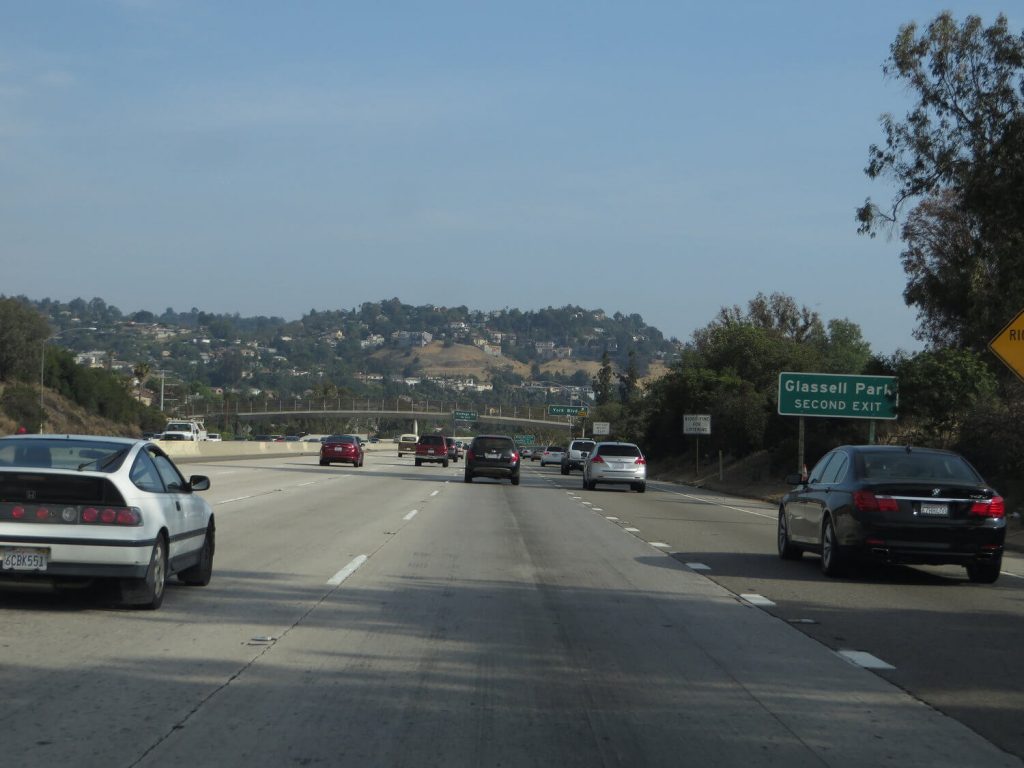
Photo by https://www.flickr.com/photos/kenlund/
6. GLENDALE, CA
Population Density: 195
Rain and Snow: 192
Glendale may not be the worst American city to drive in, but it is the worst on the West Coast. The city’s ranking is surprising, given that Los Angeles has the worst reputation for drivers — but Los Angeles is just two spots away. Drivers in Glendale are 79 percent more likely to get into an accident than the average American driver. And Glendale drivers go just five 5.5 years in between insurance claims. Traffic density and distracted driving are significant factors for the safety of Glendale drivers.
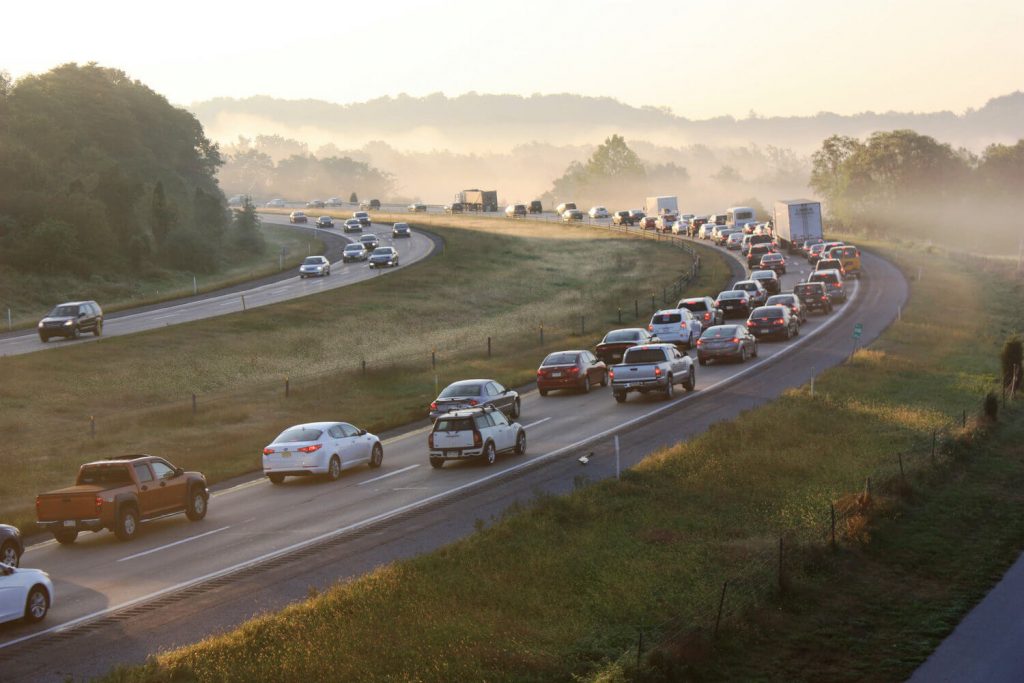
Photo by https://www.flickr.com/photos/75012107@N05/
7. PROVIDENCE, RI
Population Density: 194
Rain and Snow: 194
Hard Braking Events per 1,000 miles: 15.3
Rhode Island is a small state with a big driving problem. Drivers in Providence are more accident-prone than many others in America. On average, Providence drivers will be involved in an accident every 5.4 years — a rate that is 85 percent higher than the national average. Often, drivers in Providence fail to use turn signals and often exceed the speed limit. Some even practice illegal yields and accelerate toward red lights and traffic when they should really be slowing down.
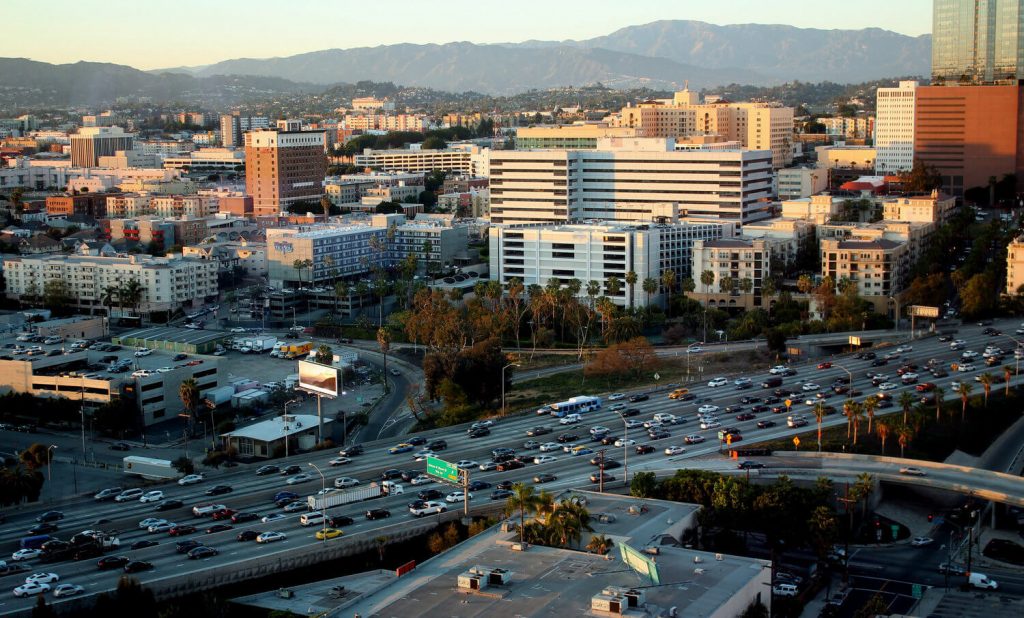
Photo by https://www.flickr.com/photos/prayitnophotography/
8. LOS ANGELES, CA
Population Density: 192
Rain and Snow: 193
Los Angeles is known to house the hottest celebrities in the business. With the stars come the crowds. Los Angeles has long had a reputation for the worst traffic, road rage, and rude drivers in America. Los Angeles residents go just 6.3 years in between crashes and have a 58.8 percent higher chance of a collision than the national average. Drivers in Los Angeles are known for their excessive (and dangerous) tailgating, blocking lane changes, failing to use blinkers, and absolutely freaking out on the roads any time there’s a drop of rain.
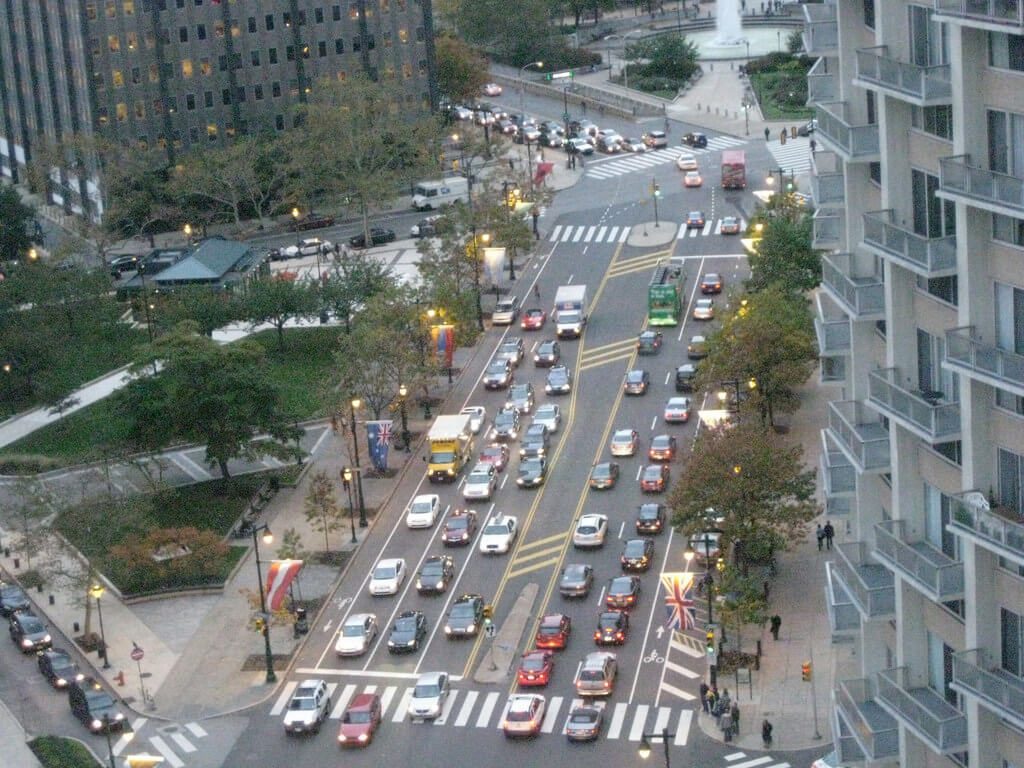
Photo by https://www.flickr.com/photos/fritz_pj/
9. PHILADELPHIA, PA
Population Density: 188
Rain and Snow: 192
Hard Braking Events per 1,000 miles: 33
Philly drivers really love to slam on their brakes. While their population density, rain, and snow aren’t as bad as some of the other cities on this list, they have significantly more braking events than others. Drivers in Philadelphia have 33 hard braking events per 1,000 miles, but the national average is 19. That means more accidents and more dangerous driving. On average, Philadelphia drivers get into an accident every 6.2 years. They’re 61.2 percent more likely to have a collision than the average American.
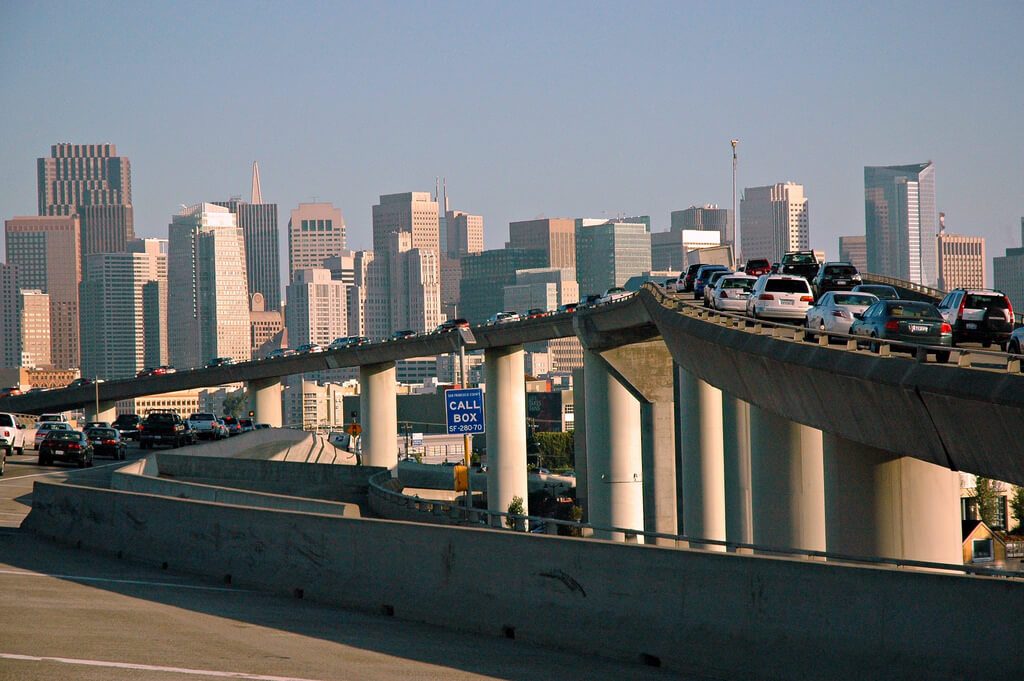
Photo by https://www.flickr.com/photos/wonderlane/
10. SAN FRANCISCO, CA
Population Density: 150
Rain and Snow: 191
Drivers in San Francisco have only 6.4 years between accidents. They’re 55.6 percent more likely to have accidents than the average American driver as well. What’s wrong in San Francisco? A high rate of pedestrian accidents, heavy traffic delays and commute times, high gas prices, poor roads and bridges, a high rate of car thefts, and high auto maintenance costs. And, of course, driving on San Francisco’s scenic hills can be both beautiful and dangerous. The fog, one-way streets, and often, no left turns make it difficult to see and navigate in San Francisco as well.
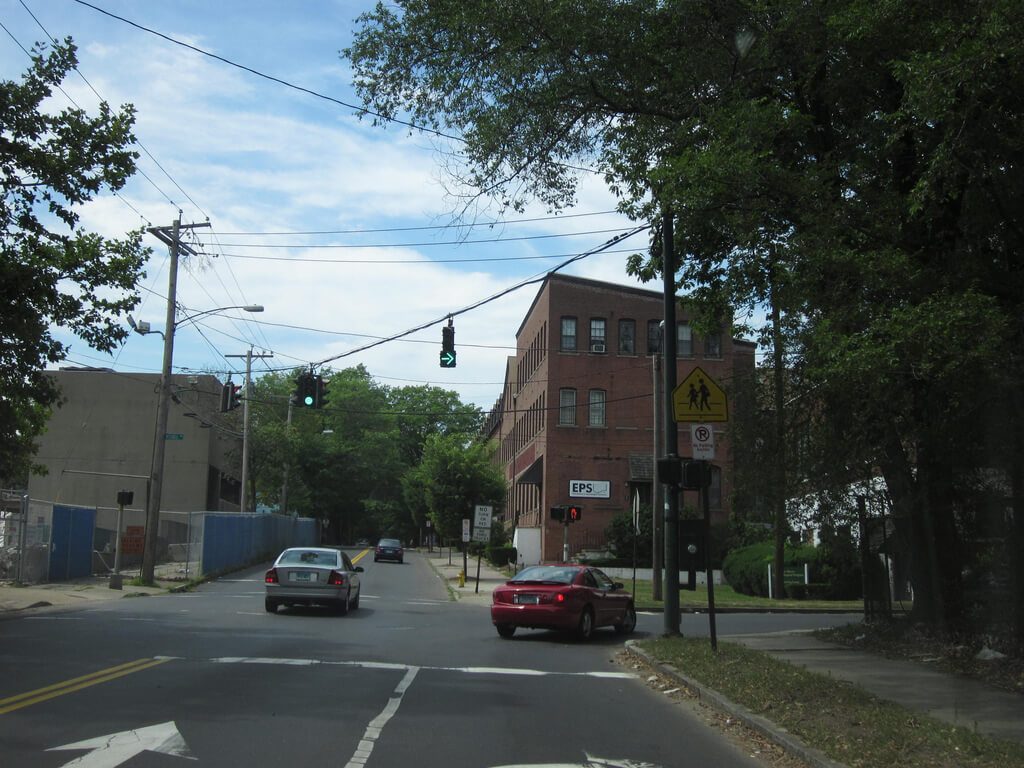
Photo by https://www.flickr.com/photos/dougtone/
11. NEW HAVEN, CT
Population Density: 190
Rain and Snow: 187
Hard Braking Events per 1,000 miles: 20.8
New Haven drivers have it rough. They experience a car collision every six years on average — and they’re 59 percent more likely to get into an accident than the average American driver. And while New Haven hasn’t reached Philadelphia levels of slamming on the brakes, they do have a higher than average rate of hard braking events.
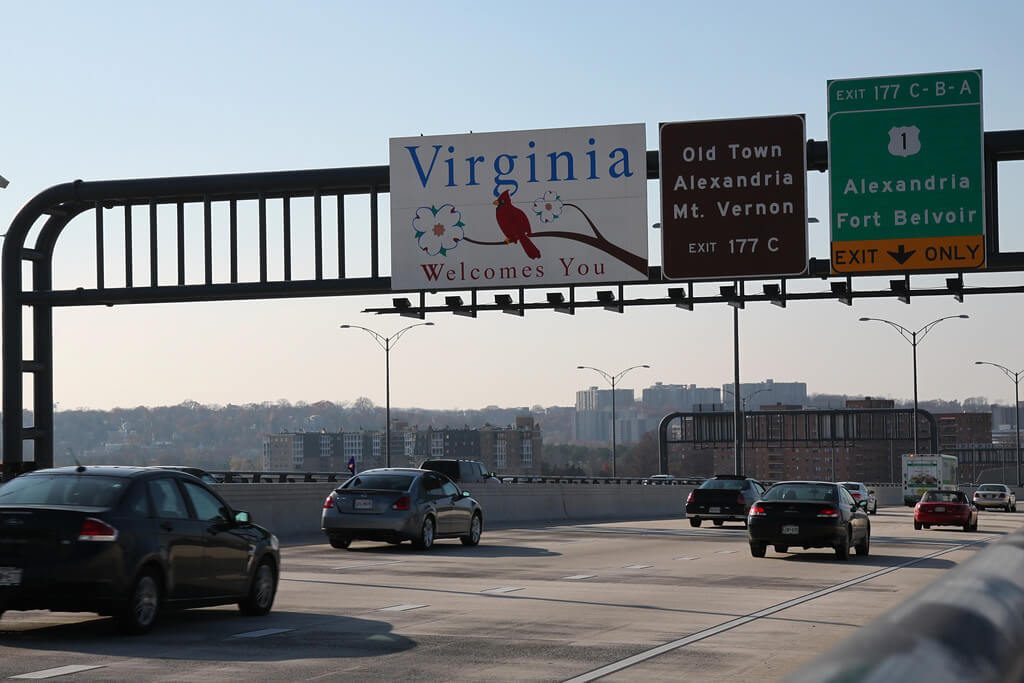
Photo by https://www.flickr.com/photos/mr_t_in_dc/
12. ALEXANDRIA, VA
Population Density: 178
Rain and Snow: 188
Hard Braking Events per 1,000 miles: 17.9
Drivers in Alexandria are 68.2 percent more likely to get into an accident than the average American. They have an accident every 5.9 years on average. Part of the Washington, D.C. region, Alexandria has some of the worst bottlenecks in the country. That, of course, plays a huge part in making Alexandria roads less safe than many others. A .3 mile-long stretch on Interstate 395 causes more than 300,000 hours of delays and wastes more than 83,720 gallons of fuel annually.
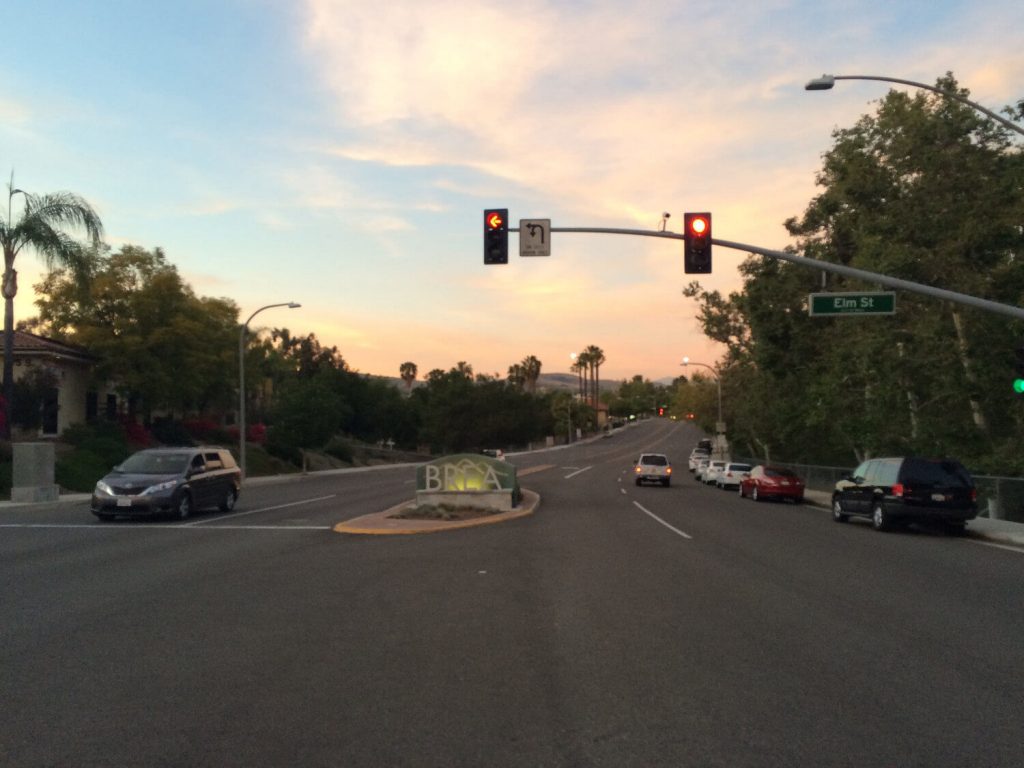
Photo by https://www.flickr.com/photos/sergeigussev/
13. FULLERTON, CA
Population Density: 187
Rain and Snow: 190
As is the case in many Southern California cities, driving safely in Fullerton can be a challenge. Drivers in Fullerton go an average of 6.8 years between claims for accidents — and that makes them 46.9 percent more likely to get into an accident than the national average. And Fullerton holds the dishonor of being one of the worst cities in California for crashes involving underage drinkers. Unfortunately, Fullerton’s driver safety doesn’t seem to be getting better. They dropped twelve cities from number 178 in 2015.
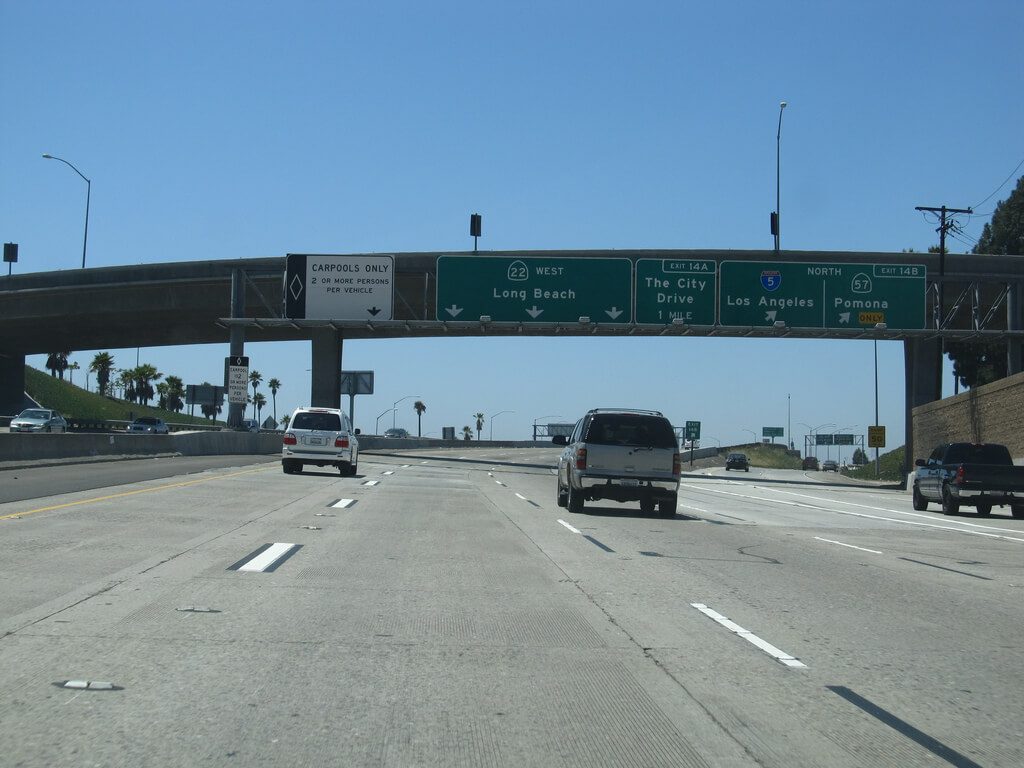
Photo by https://www.flickr.com/photos/kenlund/
14. GARDEN GROVE, CA
Population Density: 170
Rain and Snow: 189
Another driving challenged city in the Los Angeles metro area, Garden Grove, is just about as bad as Fullerton. Drivers in Garden Grove go 6.8 years in between accidents on average. This makes Garden Grove drivers 46.6 percent more likely to get into an accident than the average American driver.
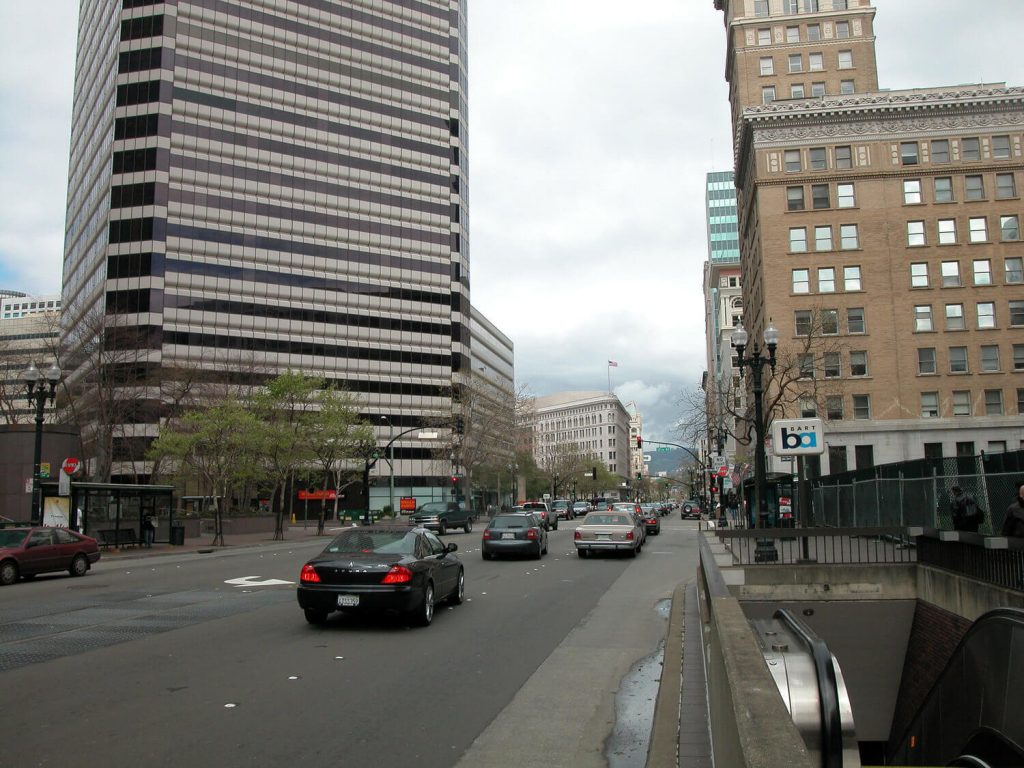
Photo by https://www.flickr.com/photos/davidwilson1949/
15. OAKLAND, CA
Population Density: 176
Rain and Snow: 186
Although they’re out of the Los Angeles metro area, Oakland drivers still aren’t safe. In fact, driving in Oakland is almost as bad as Fullerton or Garden Grove. Oakland drivers go about 6.9 years between accidents, making them 44.4 percent more likely to experience a collision than the average American. Part of the problem is improper turn signal use and red-light running. And Oakland drivers aren’t taking it easy: they are often among the most stressed due to extensive traffic on freeways.
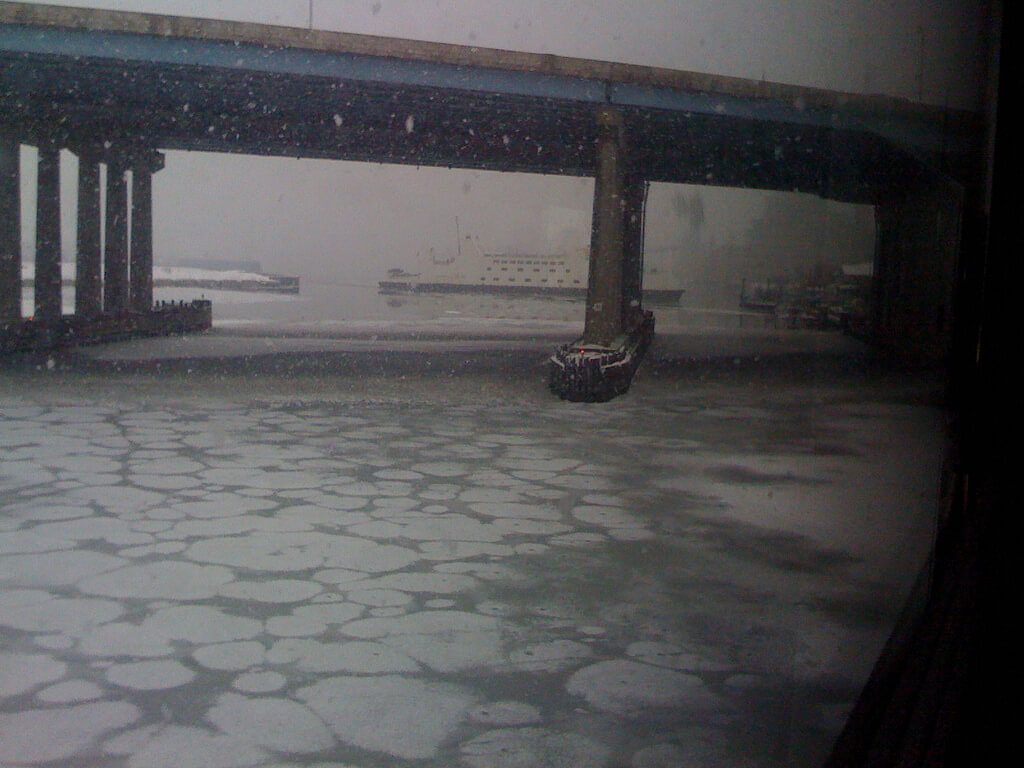
Photo by https://www.flickr.com/photos/ct_barbarian/
16. BRIDGEPORT, CT
Population Density: 159
Rain and Snow: 185
Hard Braking Events per 1,000 miles: 22.8
Drivers in Bridgeport are at the mercy of the road. Typically, Bridgeport drivers will go about 7.0 years in between accidents. That’s a 42.3 percent higher likelihood Bridgeport drivers will experience an accident than average American drivers. And they’re slamming on their brakes while they do it: Bridgeport has a higher than average rate of hard braking events.
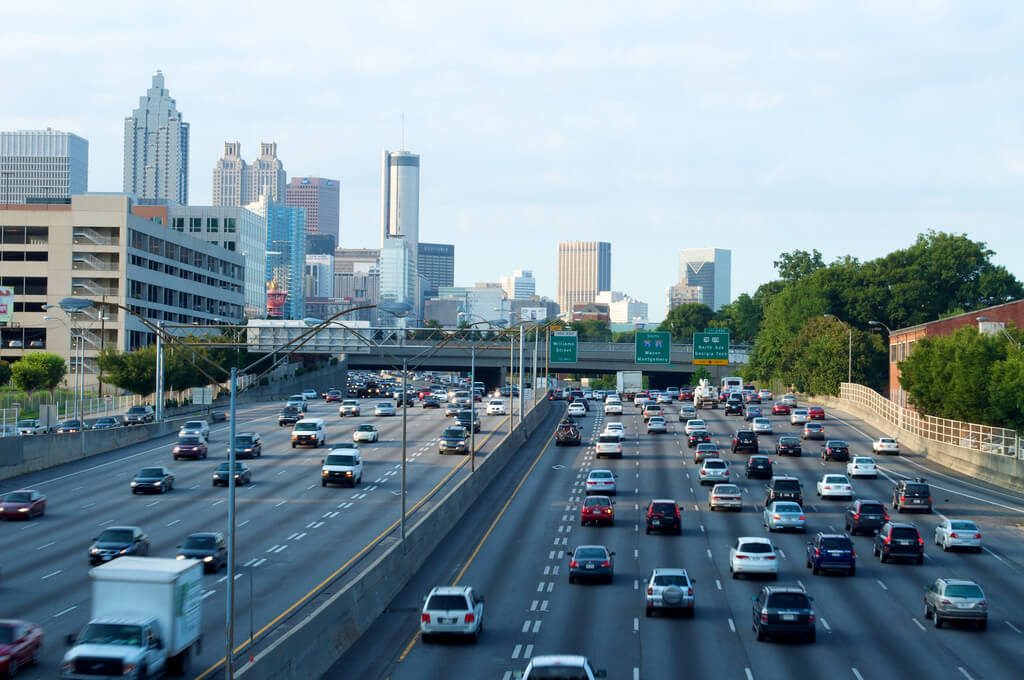
Photo by https://www.flickr.com/photos/macgodbrad/
17. ATLANTA, GA
Population Density: 191
Rain and Snow: 182
Hard Braking Events per 1,000 miles: 19.6
Traffic in Atlanta continues to get worse, and as traffic suffers, so do Atlanta’s drivers. Drivers in Atlanta will have an accident about every 7.1 years. At that rate, they are 40.7 percent more likely to experience a collision than many other Americans. And accidents certainly aren’t helping traffic in the city — for many drivers, it seems you can’t avoid traffic even if you’re driving in the middle of the night because you’re bound to come across an accident.
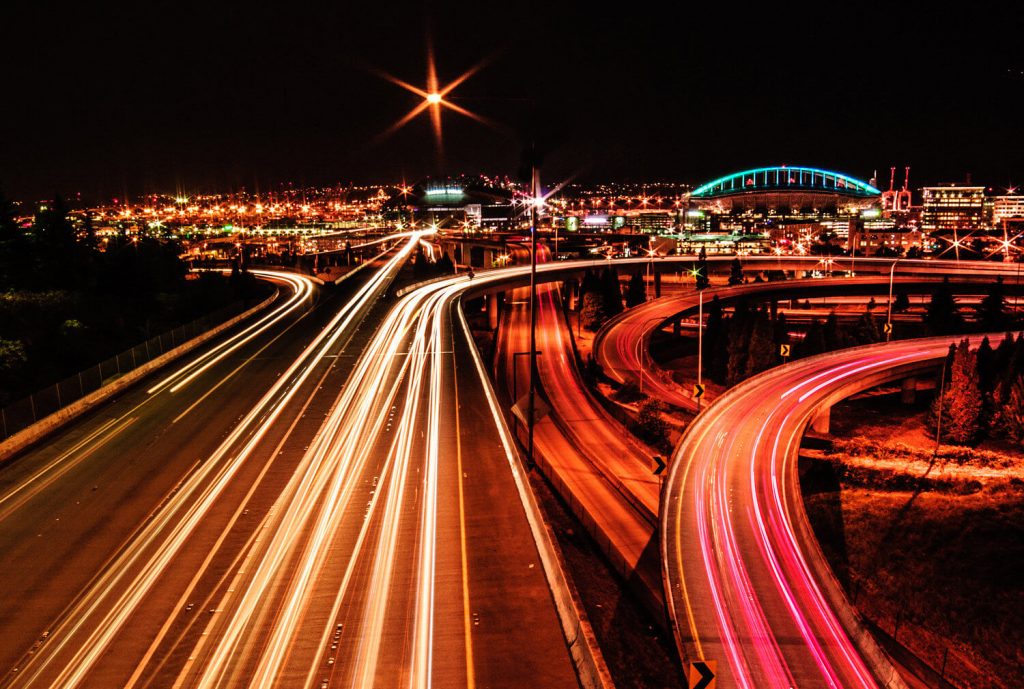
Photo by https://www.flickr.com/photos/thgeorge/
18. SEATTLE, WA
Population Density: 160
Rain and Snow: 184
Hard Braking Events per 1,000 miles: 15.5
Although Seattle has far less population density than Atlanta, driving in Seattle is practically just as bad. Seattle drivers usually go about 7.1 years between accidents, making drivers 40.4 percent more likely to experience a collision than average. And in addition to frequently wet conditions, traffic, new construction, and increased city growth mean that Seattle driving is likely to worsen before it gets better.
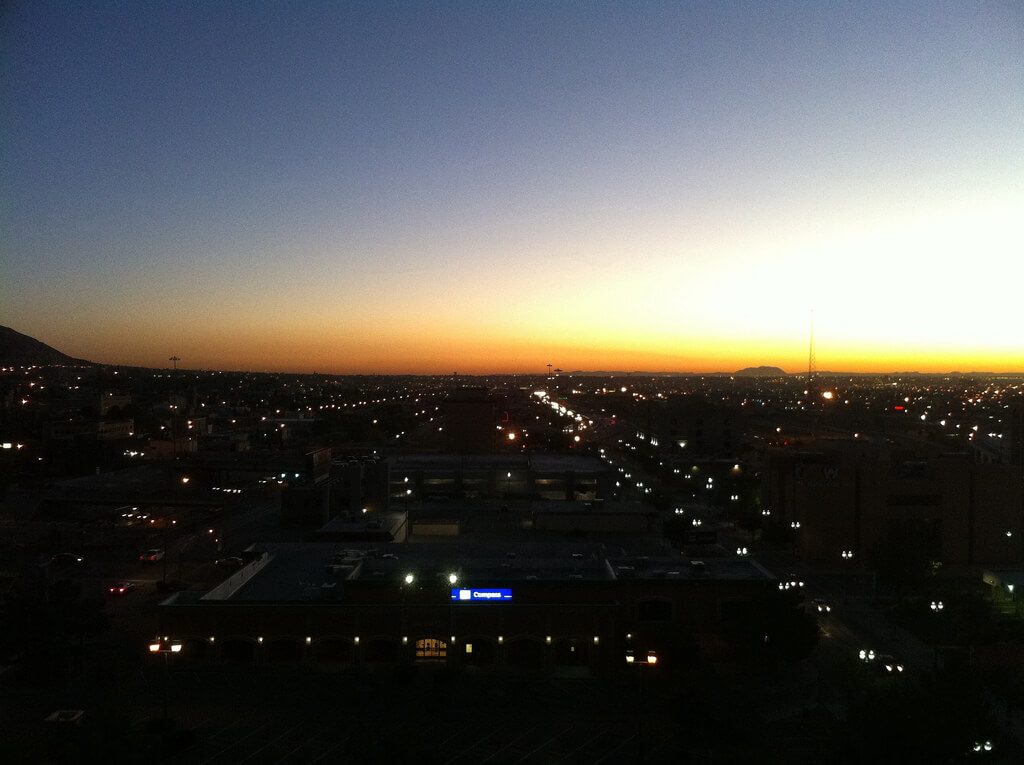
Photo by https://www.flickr.com/photos/torres21/
19. GARLAND, TX
Population Density: 184
Rain and Snow: 181
Part of the Dallas Fort Worth area, Garland is the worst Texas city to drive in. Drivers in Garland are more accident-prone than anywhere else in the state. Drivers go an average of 7.2 years in between accidents in Garland, which makes them 39.1 percent more likely to experience a collision. What’s wrong with the traffic in Garland? As a rapidly growing city, the biggest problem is having too many people and not enough room. The roads in Garland simply aren’t ready for what the suburb is dishing out.
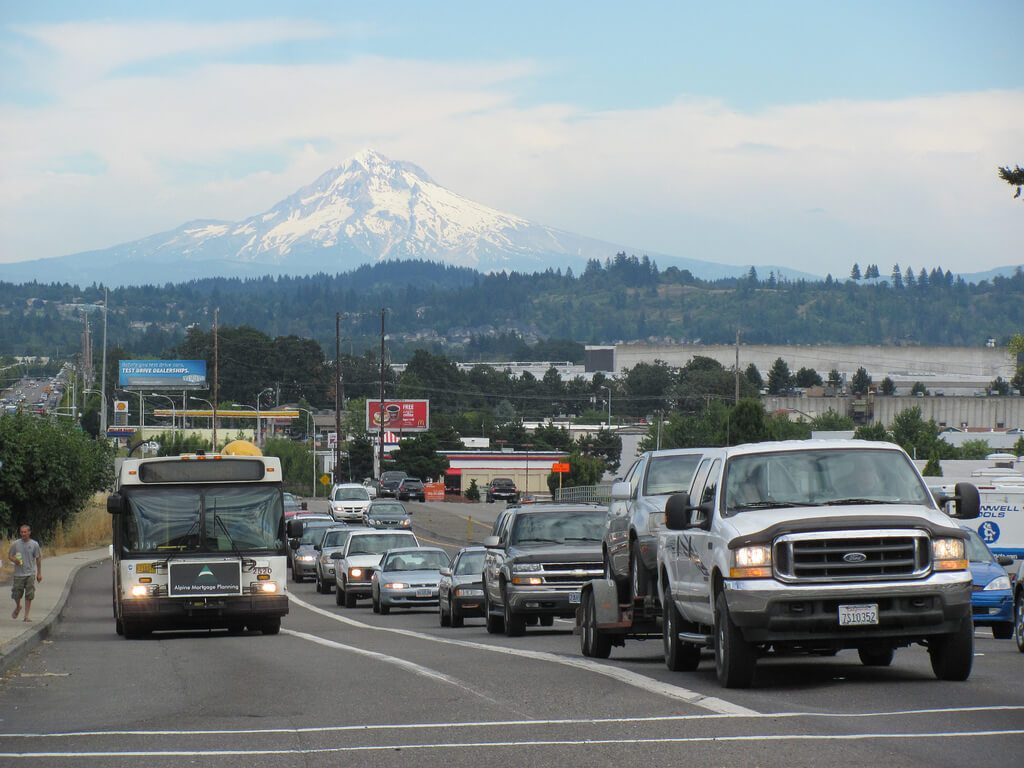
Photo by https://www.flickr.com/photos/theslowlane/
20. PORTLAND, OR
Population Density: 182
Rain and Snow: 184
Hard Braking Events per 1,000 miles: 18.3
Though slightly better than neighboring Seattle, Portland is still among the top 20 worst cities to drive in among the United States. Portland drivers are 39 percent more likely to experience an accident, with a typical 7.2 years between collisions. Portland is challenged by traffic-related deaths, particularly involving pedestrians. Other factors causing many accidents in Portland include drugs and alcohol, speed, low light conditions, and improper roadway or lane departures.